I have tracked my dividends in spreadsheets for years. I have spreadsheets for my spreadsheets. And the question every one of them eventually tries to answer is the same: how much will this actually pay me, and when?
So here is the calculator I wish I had started with. Put in what you have, what you add each month, and what your holdings yield. It shows your future monthly dividend income with or without reinvesting (DRIP), how dividend growth and taxes change the picture, and, if you flip it around, how much you need invested to hit a monthly income goal. No email required. No upsell. It just does the math.
Dividend Calculator
Year-by-year table
| Year | Put in | Dividends that year | Per month | Value |
|---|
Estimates only, not advice. Assumes steady growth, monthly contributions, and dividends paid monthly. Real dividends get cut, prices drop, and yields change.
Where to actually buy the dividend stocks: your broker changes the numbers above more than you would think, because DRIP, fees and fractional shares all matter. My best brokerages for dividend investing compares the ones that handle reinvesting well, and these 6 dividend ETFs are an easy place to start.
Want the next calculator before anyone else? The Verdict newsletter sends one honest take a week, plus new calculators and fee changes as they happen. No hype, no hot stock tips.
How to Use the Dividend Calculator
There are two modes. “Project my dividend income” starts from what you have and shows where it goes. “How much do I need?” starts from the income you want and works backward. Here is what each box means:
- Starting investment: what you have in dividend stocks or funds today.
- Monthly contribution: what you add every month. This is the box that matters most, and it is the one nobody likes to look at.
- Dividend yield: a year of dividends divided by the share price. A fund paying $3.50 a year on a $100 share yields 3.5%. Your broker or any quote page shows it.
- Dividend growth per year: how fast the payout itself rises. Companies that raise dividends every year often grow them somewhere in the mid single digits, but that is history, not a promise.
- Share price growth per year: how fast the shares go up. This drives the portfolio value and how many shares your new money buys.
- Tax on dividends: use 0 for an IRA or Roth. In a taxable account, use the rate you actually pay on dividends.
- Reinvest dividends (DRIP): checked means every dividend buys more shares. Unchecked means you take the cash.
Open the year-by-year table under the chart to see how much you put in, what the portfolio paid that year, and what it was worth. That table is where the real story is, because it shows how slow the first ten years feel.
Dividend Yield Calculator for a Single Stock
Want to check one stock instead of a whole portfolio? Put in the share price and the yearly dividend per share, and this shows the yield, what your shares pay you, and your yield on cost if you bought in at a different price.
What the Numbers Actually Say
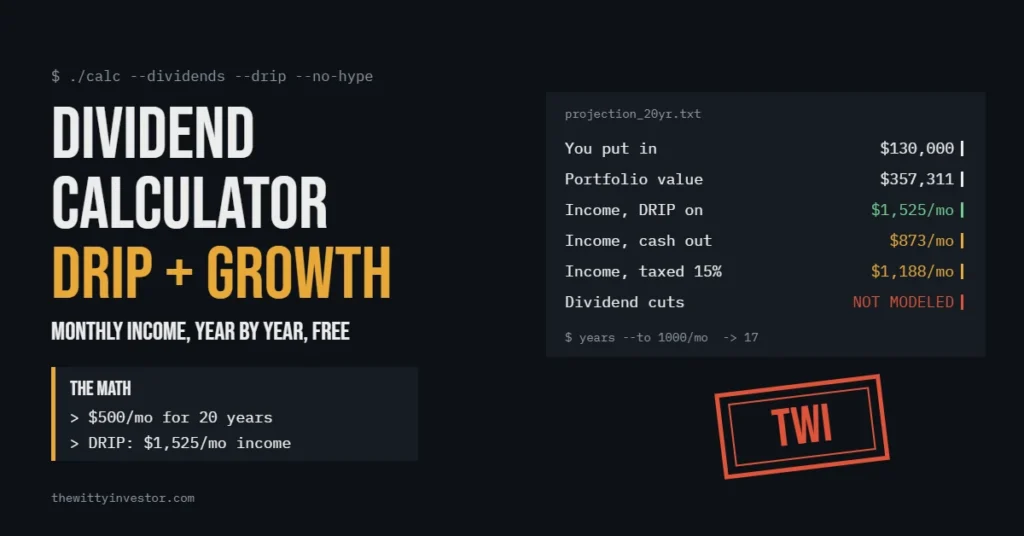
Here is the default example: $10,000 to start, $500 a month, a 3.5% yield, dividends growing 6% a year and share prices growing 4%, for 20 years, in a tax-free account. You put in $130,000 over that time. Here is what changes when you change one thing.
| Scenario | Monthly income after 20 years | Portfolio value |
|---|---|---|
| Default, dividends reinvested | $1,525 | $357,311 |
| Same, but you take the cash (no DRIP) | $873 | $287,981 |
| Reinvested, taxable account at 15% | $1,188 | $327,517 |
| Reinvested, only 10 years | $397 | $112,535 |
| Reinvested, 30 years | $5,245 | $1,015,506 |
DRIP is the difference between a nice check and a real one
Same money in, same stocks. Reinvesting gets you $1,525 a month after 20 years. Taking the cash gets you $873. Reinvesting buys shares, those shares pay dividends, those dividends buy more shares. It is compounding, but with a paycheck attached. If you do not need the income yet, turning DRIP on is the single easiest thing you can do. Most brokers do it for free; my list of the best brokerages for dividend investing covers which ones handle it well.
Time does the heavy lifting
Ten years gets you $397 a month. Twenty gets you $1,525. Thirty gets you $5,245. The second decade is worth almost four times the first, and the third is worth more than three times the second. That is why the chart looks like a ski jump. It is also why the first few years feel pointless. They are not pointless. They are the ramp.
Taxes quietly eat the snowball
A 15% tax on dividends does not cost you 15% of the income. It costs you more, because every taxed dividend reinvests a smaller amount, which buys fewer shares, which pay fewer dividends. In the example, $1,525 drops to $1,188, a 22% haircut. If you have the choice, dividend stocks are happiest in an IRA or Roth.
How Much Do You Need to Make $1,000 a Month in Dividends?
This is my own goal, so I have done this math more times than I would like to admit. $1,000 a month is $12,000 a year. Divide by your yield and you have the answer.
| Portfolio yield | Invested for $1,000 a month |
|---|---|
| 2.5% | $480,000 |
| 3.5% | $342,857 |
| 5% | $240,000 |
| 8% | $150,000 |
Look at that 8% row and feel the temptation. Then remember that a yield that high usually means the market expects a cut. I wrote a whole post on why chasing yield goes wrong. A 3% yield that grows beats an 8% yield that gets slashed in half. For the full plan, including how long it really takes, read how to make $1,000 a month in dividends.
How This Calculator Works
No black box. Here is exactly what it does, so you know what to trust and what to take with salt.
- It runs month by month. Each month your contribution buys shares at the current price, and dividends are paid as one-twelfth of the yearly rate.
- The dividend per share rises once a year by your dividend growth rate. The share price rises a little every month by your price growth rate.
- With DRIP on, after-tax dividends buy more shares. With DRIP off, they pile up as cash, which counts toward portfolio value but earns nothing.
- The income shown is the run rate: what the portfolio is paying per year as you head into the next year. That is the number that matters when you are deciding whether you can live on it.
- “How much do I need?” divides your goal by your yield and adjusts for tax. Then it projects your inputs forward, with DRIP on, until the after-tax income reaches the goal.
One honest warning. If you set dividend growth well above price growth, the yield on your portfolio keeps climbing every year, because the payout outruns the price. Over a few years that is realistic. Over thirty, it makes the results look better than real life usually does. Keep the two numbers within a couple of points of each other unless you have a good reason.
Mistakes That Make Dividend Projections Lie
- Using today’s highest yield. Use your whole portfolio’s yield, not the one stock that pays 9%.
- Assuming dividends never get cut. They do. Even good companies freeze or trim them in a bad year.
- Forgetting fees. A 0.5% fund fee comes straight out of a 3.5% yield. My fee drag calculator shows what that costs over 20 years.
- Forgetting taxes in a taxable account. Put in your real rate. The difference is bigger than it looks.
- Never checking against reality. A projection is a guess. Track what actually lands in your account; a dividend tracker app or a humble spreadsheet will do it.
Put This Dividend Calculator on Your Site
Run a blog, an investing club page or a newsletter? You are welcome to embed this calculator for free. Paste the code below into a Custom HTML block or your site’s HTML. It updates itself whenever I improve it, and all I ask is that you keep the credit link.
Frequently Asked Questions
How do you calculate dividend income?
Multiply the amount invested by the dividend yield. $10,000 at a 3.5% yield pays about $350 a year, or about $29 a month. Over time, add new contributions, reinvested dividends and dividend growth, which is what the calculator above does for you.
What is a DRIP calculator?
A DRIP calculator shows what happens when every dividend is reinvested into more shares instead of paid out as cash. Check the “Reinvest dividends” box above to turn DRIP on, and uncheck it to compare.
How do I calculate dividend yield?
Divide a year of dividends per share by the share price, then multiply by 100. A stock paying $2 a year and trading at $50 yields 4%. The single-stock calculator above does it for you.
What is yield on cost?
Your current yearly dividend income divided by what you originally put in. If you invested $130,000 and it now pays $18,305 a year, your yield on cost is about 14%. It is a nice number to look at, but it says more about patience than about the stock you own today.
How much do I need to invest to make $1,000 a month in dividends?
About $342,857 at a 3.5% yield, $480,000 at 2.5%, or $240,000 at 5%, before taxes. Divide $12,000 by your yield to get your number.
Is this calculator accurate?
The math is accurate. The future is not. It assumes steady growth every year, and real markets do not cooperate. Use it to compare choices, like DRIP versus cash or a Roth versus a taxable account, not to predict an exact number.
Bottom Line
Dividend income is slow, then sudden. The calculator makes that obvious in about ten seconds: reinvest while you can, keep taxes and fees low, keep adding every month, and give it time. If you want somewhere to put that monthly money, start with these 6 dividend ETFs. Then bookmark this page and come back in a year to see how reality compares. Mine is usually a little behind the spreadsheet. I am slowly getting there anyway.