Researched · Fees checked November 2026 · Reviews
Some links may earn a commission, and that never changes a verdict. Full disclosure: I have not subscribed to Simply Safe Dividends or run its free trial. Everything below comes from the company’s own pricing, methodology and track-record pages, linked where they’re used. Here’s how I label reviews and why “Researched” means exactly that.
This Simply Safe Dividends review starts with a confession. I track my dividends in spreadsheets. Several of them. I have spreadsheets that exist to keep an eye on other spreadsheets, which is either diligence or a cry for help, depending on who’s asking.
What a spreadsheet can’t tell me is whether the next check is coming. It records the dividend. It does not have opinions about the dividend. And opinions about the dividend are exactly what Simply Safe Dividends sells, for $468 a year, paid up front, no monthly option.
That’s not a small number for a dividend tool. So the question isn’t “is it good?” It’s narrower and more useful: does it catch enough cuts, early enough, to pay for itself on your portfolio?
Simply Safe Dividends Review: The Verdict Up Front
PASS if your portfolio is big enough that one dividend cut costs you more than $468. In practice that means roughly $100,000 or more in individual dividend stocks, where the fee drops under half a percent a year, and it gets easier to justify with every zero after that.
SKIP if you’re still building. On a $25,000 portfolio, $468 a year is 1.9% of the whole thing. You’d fire a fund manager for charging that.
The one-line version: the best dividend-safety ratings I’ve found that are run by humans and publish their own misses. Priced for people who already have the income worth protecting.
Price: $468/year (shown as $39/month, billed annually) · Free trial, no card · 60-day refund for first-time subscribers · Check current pricing
What Simply Safe Dividends Actually Is
It’s a research service that happens to track your portfolio, not a tracker that happens to do research. That distinction matters, because it explains the price. You’re not paying for an income calendar. Free apps have income calendars. You’re paying for analysts to put a number on whether a dividend survives the next bad year.
That number is the Dividend Safety Score, and nearly everything else on the platform is built around it: the portfolio view, the alerts, the screeners, the newsletter. If you don’t care about the score, there’s very little reason to be here.
Who built it
Simply Safe Dividends was started in 2015 by Brian Bollinger, whom the company describes as a CPA and former equity analyst. It’s a focused operation that does one thing. There’s no crypto tab and no AI price-target chatbot, and nobody’s promising you’ll retire by Thursday. The company’s homepage calls it “boring and conservative,” which, in this industry, is the most honest marketing line I’ve read all year.
How the Dividend Safety Scores Work
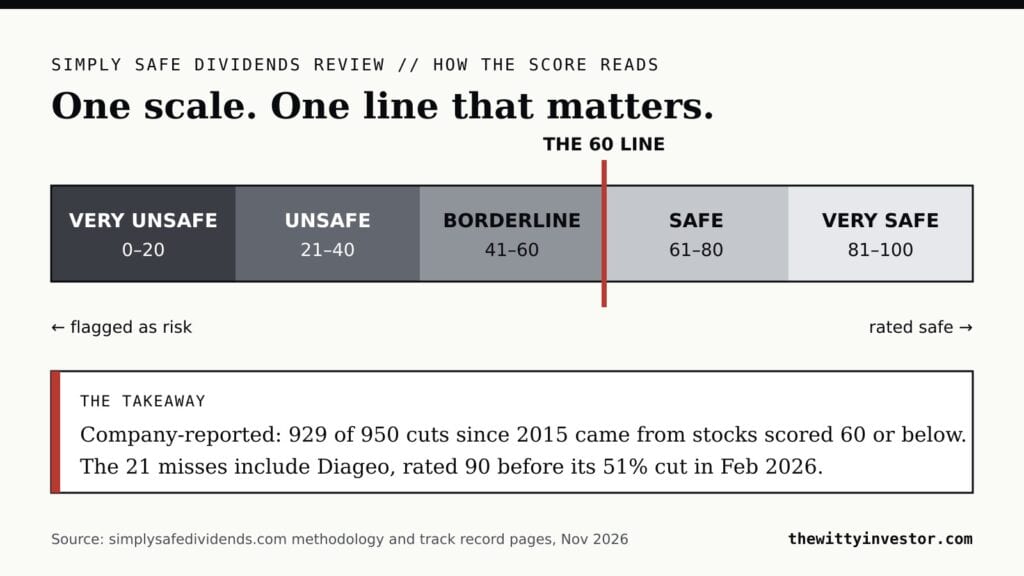
Every covered stock and closed-end fund gets a score from 0 to 100, sorted into five buckets. The methodology page lays it out plainly:
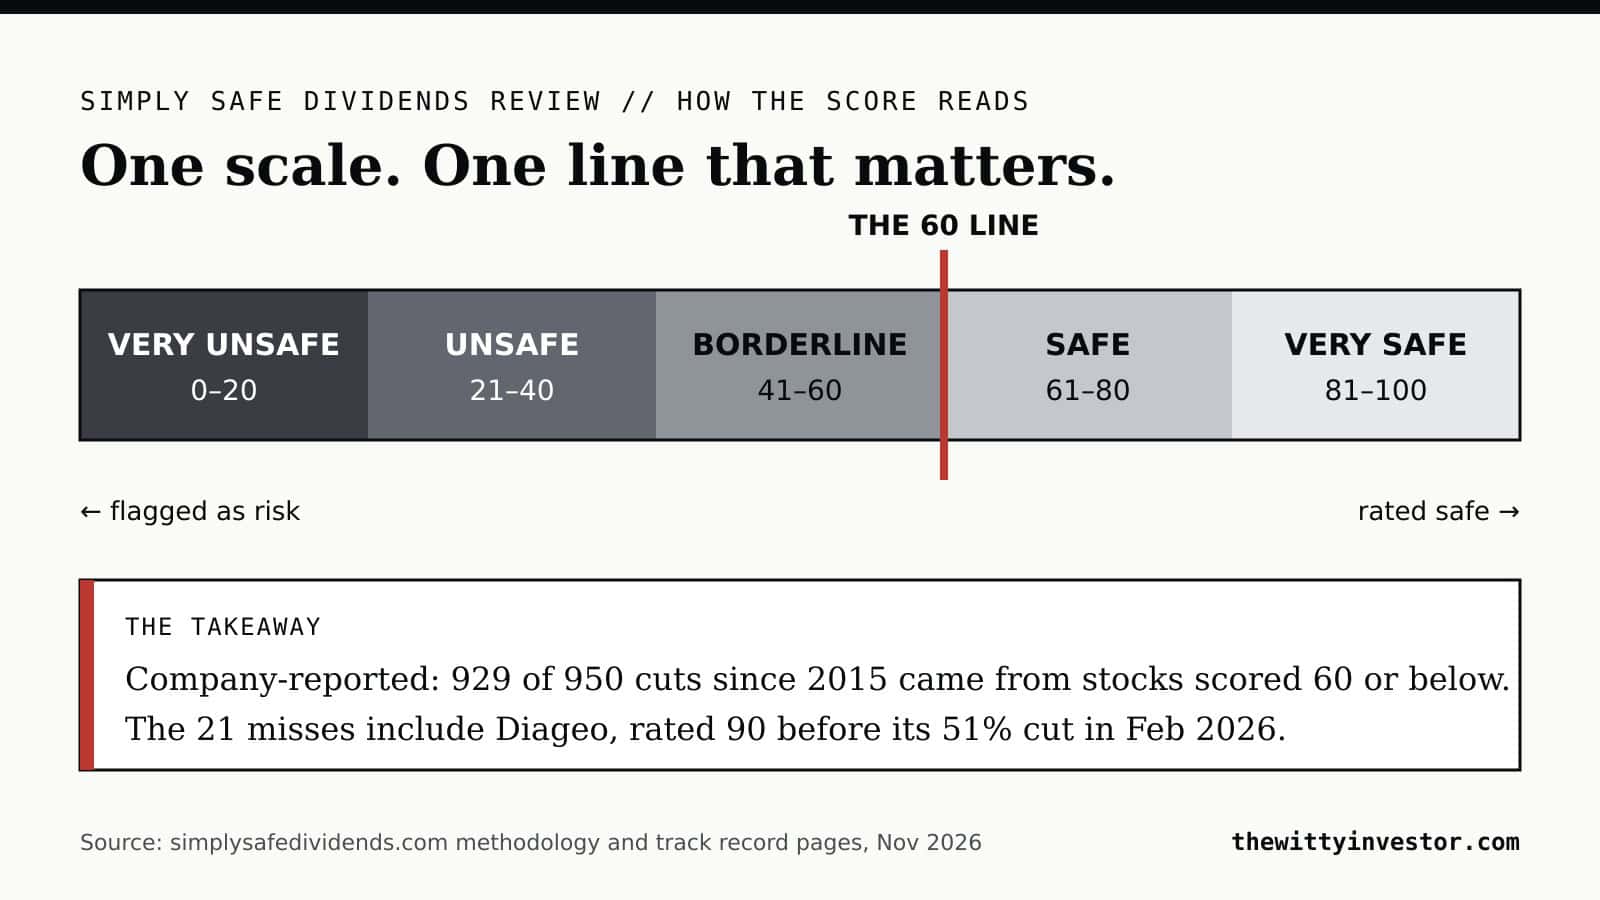
- 81–100, Very Safe: very unlikely to be cut
- 61–80, Safe: unlikely to be cut
- 41–60, Borderline: moderate risk
- 21–40, Unsafe: heightened risk
- 0–20, Very Unsafe: high risk
What goes into the score is the stuff you’d check yourself if you had the time and the patience: payout ratios, debt levels and coverage, free cash flow, how the business held up in past recessions, how long the dividend has been paid, and how cyclical the industry is. It also uses industry-specific measures like AFFO for REITs, which matters, because judging a REIT on an earnings payout ratio is how people end up very confused and slightly poorer.
Two details earn real credit. First, humans assign the scores. The data feed comes from S&P, but an analyst makes the call. Second, every score is reviewed at least once a quarter after earnings, and the review date is published. You can see exactly how stale a rating is, which is more than most “proprietary” grading systems will tell you.
The 97% Track Record, Read Properly
The headline claim: since 2015, investors who stuck to stocks scoring above 60 would have avoided 97% of dividend cuts, 929 of 950. I read the whole track-record page, which is long, so you don’t have to. You’re welcome. And I’m sorry.
What it gets right
It publishes its misses, and not quietly either. When Diageo cut its dividend 51% in February 2026, the stock had been rated 90, Very Safe. The company calls it “one of the most significant misses” in its record, in writing, on its own sales page. Advance Auto Parts scored 80 before an 83% cut in 2023. Celanese scored 70 before slashing its payout 95% in 2024, and the write-up admits the analysts trusted a low payout ratio too much.
Meanwhile, the catches look like what you’d want. Arbor Realty sat at 20, Very Unsafe, before it suspended its dividend in October 2026. Oxford Square Capital sat at 8 before a 57% cut the same day.
I’ll take a rating system that shows me its failures over one that claims it has none. The second kind exists. It is usually selling a course.
What the 97% doesn’t tell you
Here’s the part the testimonials skip. The 97% figure measures one kind of error: cuts the scores missed. It says nothing about the opposite error, the stocks rated Borderline or Unsafe that never cut at all. If a system scared you out of a perfectly good dividend payer, that costs you income too. It just doesn’t show up in this stat, because nobody makes a chart of disasters that didn’t happen.
The definition of “avoided” also isn’t spelled out in detail, and the pandemic numbers deserve a footnote. For 2020, the company’s headline figure uses scores that were updated during the year as things fell apart. Using the January 2020 ratings instead, the before-the-storm snapshot, the company says 93% of that year’s cuts came from stocks rated below Safe. That’s still a strong result. It’s just not the 97% on the banner. (Yes, I checked the footnotes. They made me feel about 4 percentage points less excited.)
And all of it is self-published. I couldn’t find an independent audit. That doesn’t make it wrong. It means you’re trusting the grader to grade its own homework, and the best you can say is that it’s showing its work.
What $468 a Year Buys
Per the pricing page, one plan gets you everything. No tiers, no “Pro Plus Ultra” upsell.
Portfolio tracking and alerts
Unlimited portfolios, an income calendar, and a forecast of the year ahead. Holdings can sync through your broker, or you can enter them by hand or upload a CSV. The useful part is the alerts. When a holding raises or cuts its dividend, or when its safety score changes, you get an email with the analyst’s reasoning. That last bit is the product. Anyone can tell you a dividend got cut. The point is hearing about the deterioration before the board does anything about it.
Screeners, valuation and credit data
Stock and closed-end fund screeners with dozens of filters, valuation charts that compare price to fair value and current yield to the 5-year average, 10-year financial charts, and S&P credit ratings. The yield-versus-average chart is a quietly great sanity check. A yield far above its own history is usually the market telling you something, and it’s rarely “congratulations.”
Research and model portfolios
Analyst write-ups on covered companies, plus a newsletter with model portfolios. If you want someone else’s idea list, it’s there. If you’re the type who builds your own, you’ll mostly ignore it, and that’s fine.
Simply Safe Dividends Pricing and Fine Print
The price is $468 a year. The site displays it as $39 a month, but the FAQ is clear that there’s only an annual subscription. You cannot pay monthly. “$39/month” is a unit of measurement, not a payment option.
- Free trial: 14 days, no credit card required
- Refund: 60-day money-back guarantee, first-time subscribers only
- Renewal: auto-renews by default, with an email warning two weeks before. You can switch it off in your account, and I’d suggest doing that the day you sign up and then deciding on purpose.
Now the math that actually decides this. At a 3.5% yield, it takes roughly $13,371 invested just to generate $468 in annual dividends. On a small portfolio, the subscription eats a meaningful chunk of the income it’s supposed to protect.
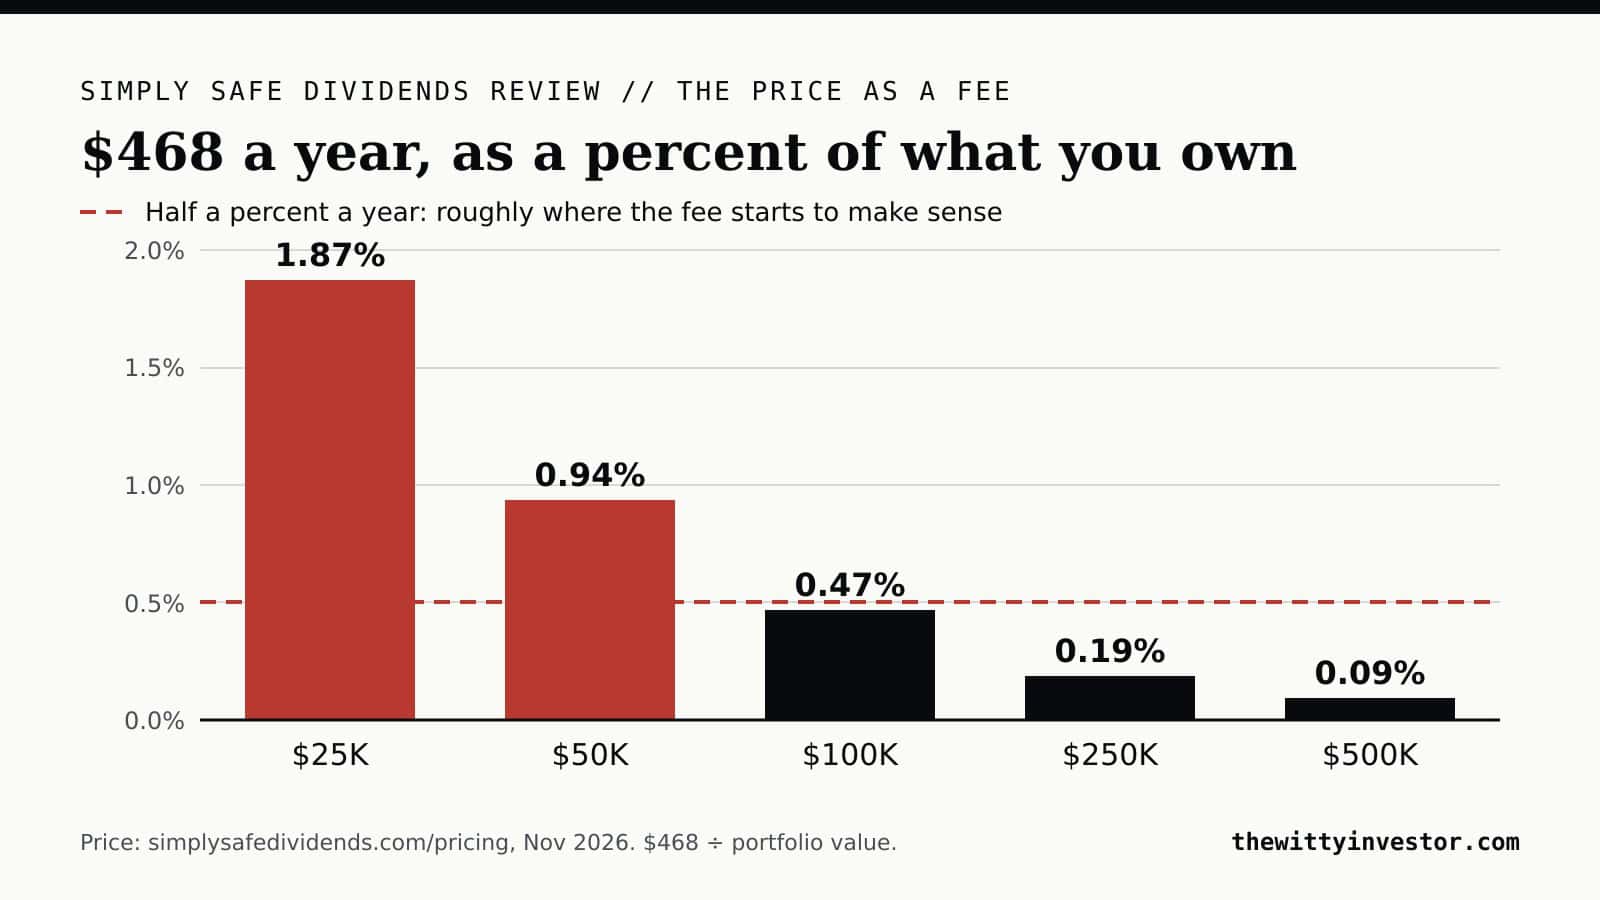
Treat it like an expense ratio, because that’s what it is. At $25,000 invested, $468 is 1.87% a year. At $100,000 it’s 0.47%. At $500,000 it’s 0.09%, which is index-fund territory. If you want to see what a 1.87% annual drag does over a couple of decades, run it through the fee drag calculator. It isn’t pretty, and it doesn’t care that the fee was for safety.
The other side of the ledger: say you hold $20,000 of a stock yielding 5%. That’s $1,000 a year. A 50% cut takes $500 of it, more than a year of the subscription, and that’s before the share price reacts, which it usually does with some enthusiasm. One avoided cut on a position that size covers the bill. The question is whether your positions are that size yet.
Pros and Cons
Pros
- Human analysts assign the scores, and every score shows its last review date
- The track record is public and names its biggest misses, including recent ones
- Score-change alerts arrive with the reasoning attached, not just a number that moved
- Industry-specific metrics for REITs and similar businesses, where generic ratios mislead
- One plan, everything included, unlimited portfolios
- Free trial without a credit card, plus a 60-day refund window
Cons
- $468 a year, annual only. There’s no cheap way to stay a few months.
- No app in the Apple or Google stores. The company’s own phone instructions have you save the website to your home screen.
- The 97% stat measures missed cuts only and says nothing about false alarms
- The track record is self-reported, with no independent audit I could find
- The refund only covers first-time subscribers. Leave and come back, and the safety net is gone.
What Simply Safe Dividends Is Not
It is not a stock-picking service, whatever the model portfolios imply. A Very Safe dividend can belong to a company whose share price goes nowhere for a decade. Safety and returns are different questions, and this tool answers the first one.
It is not a total-return tool, either. If you care about growth stocks that pay tiny dividends or none, most of what you’re paying for won’t apply to you.
And it is not a guarantee. Diageo was rated 90. The scores lower your odds of getting blindsided. They don’t remove them, and the company says as much, which I respect. If you want a reminder of why chasing yield alone ends badly, start with the dividend delusion.
Who Simply Safe Dividends Is For, and Who Should Skip It
Worth a look if you:
- Live on, or are close to living on, your dividend income, where a surprise cut is a budget problem and not a chart problem
- Hold individual stocks, REITs or closed-end funds, especially higher-yield ones
- Have a portfolio large enough that $468 is under about half a percent a year
- Want a second opinion from someone who reads the filings for a living
Skip it if you:
- Own mostly dividend ETFs. The fund handles the stock-level risk, and you’re paying to rate things you don’t own.
- Are still building toward your first few thousand a year in dividends
- Mainly want a tracker. Cheaper tools do that well, and the dividend tracker app roundup covers them.
- Need a polished phone app. This is a web tool wearing a home-screen shortcut.
Simply Safe Dividends vs. the Alternatives
| Tool | List price | Best at | Dividend safety rating? |
|---|---|---|---|
| Simply Safe Dividends | $468/yr (annual only) | Cut-risk scores with a published track record | Yes, 0–100, human-assigned |
| Seeking Alpha Premium | $299/yr | Quant ratings, dividend grades, articles | Dividend Safety grade, part of a wider package |
| Morningstar Investor | $249/yr | Fair value estimates, fund ratings, X-Ray | No dedicated dividend score |
| Track Your Dividends | Free; Premium $99.99/yr | Income dashboard and payout calendar | No |
| Stock Events | Free up to 15 stocks; Pro $49.99/yr | Mobile alerts and dividend calendar | No |
| A spreadsheet | Free (costs you evenings) | Total control | Only if you build one |
Prices as listed in TWI’s own reviews and the vendors’ pages, checked October–November 2026. Confirm at checkout.
The honest competitor is Seeking Alpha. Premium includes its own dividend safety grade inside a much bigger research package, for $169 a year less. The difference is philosophy. Seeking Alpha’s grades are quantitative and come bundled with everything else. Simply Safe’s scores are a judgment call by an analyst with a published batting average. If you want a single, focused answer to “is this dividend safe?”, Simply Safe is built for exactly that. If you want a research buffet that includes a dividend view, read the Seeking Alpha Premium review first.
If what you really want is valuation, the Morningstar Investor breakdown is the better match, and its free side covers more than people expect.
Why I Haven’t Paid for It (Yet)
Straight answer: I haven’t used Simply Safe Dividends. My own setup is spreadsheets plus the free side of Seeking Alpha and Morningstar, and so far it has done the job for a portfolio still working toward $1,000 a month. That goal is exactly the stage where this tool is hardest to justify, which is the whole point of the verdict above. If you’re on the same path, what $1,000 a month in dividends actually takes lays out the math.
Since the trial is free and doesn’t need a card, here’s how I’d test it, and how I’d suggest you do too. Load your real holdings, not a sample portfolio. Then look for the stocks it rates Borderline or worse, read the reasoning, and ask whether you knew that already. If it tells you something you didn’t know about a position you own, that’s the product working. If it just repeats your own homework back to you in a nicer font, keep your $468.
Frequently Asked Questions
Is Simply Safe Dividends worth it?
It’s worth it when one avoided dividend cut would cost you more than $468. For most investors that means roughly $100,000 or more in individual dividend stocks, where $468 is under half a percent a year. Below that, the fee is a large share of your income.
How much does Simply Safe Dividends cost?
$468 a year, billed annually. The site shows it as $39 a month, but there is no monthly plan. A 14-day free trial needs no credit card, and first-time subscribers get a 60-day refund.
How accurate are the Dividend Safety Scores?
The company reports that stocks scoring above 60 avoided 929 of 950 dividend cuts since 2015, or 97%. That figure is self-published and counts missed cuts only, not stocks wrongly flagged as risky.
Does Simply Safe Dividends have a mobile app?
Not in the app stores. The website works on phones, and the company shows you how to save it to your home screen so it behaves like an app.
Is Simply Safe Dividends better than Seeking Alpha Premium?
For dividend safety specifically, its analyst-assigned scores and public track record are more focused. Seeking Alpha Premium costs less and covers far more ground, including its own dividend grades.
Can I cancel Simply Safe Dividends?
Yes. Auto-renewal is on by default, but you can turn it off in your account, and the company emails two weeks before renewal. First-time subscribers can request a full refund within 60 days.
Bottom Line: My Simply Safe Dividends Review Verdict
This Simply Safe Dividends review comes down to a ratio, not a feeling. The scores are the most credible dividend-safety ratings I’ve come across, and the willingness to put Diageo’s 90 on the sales page tells you more about the company than the 97% does. But $468 a year is a fixed cost, and fixed costs are brutal on small portfolios.
PASS if your dividend portfolio is big enough that the fee is under half a percent a year. SKIP if you’re still building, and come back when one cut would hurt more than the subscription.
Either way, do this before you spend a dollar: put your current yearly dividend income into the dividend calculator and see what $468 is as a share of it. If the number makes you wince, you have your answer. Then get The Verdict in your inbox so the next review comes to you.
Every review on The Witty Investor says up top whether it’s hands-on or researched. This one is Researched, and it says so in the first line. The math, as always, is real.